Published date
15 Mar, 2023
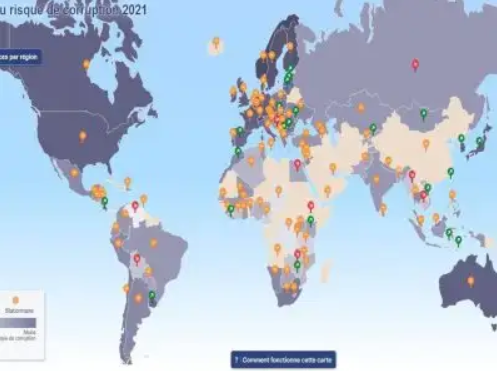
Starting with 2015 and building on the work of Alina Mungiu-Pippidi the European Research Centre for Anti-Corruption and State-Building (ERCAS) engaged in the development of a new generation of corruption indicators to fill the gap. This led to the creation of the Index for Public Integrity (IPI) in 2017, of the Corruption Risk Forecast in 2020 and of the T-index (de jure and de facto computer mediated government transparency) in 2021. Also since 2021 a component of the T-index (administrative transparency) is included in the IPI, whose components also offer the basis for the Corruption Risk Forecast.
This generation is different from perception indicators in a few fundamental aspects:
1.Theory-grounded. Our indicators are unique because they are based on a clear theory- why corruption happens, how do countries that control corruption differ from those that don’t and what specifically is broken and should be fixed. We tested for a large variety of indicators before we decided on these ones.
2.Specific. Each component is a measurement based on facts of a certain aspect of control of corruption or transparency. Read methodology to follow in detail where the data comes from and how these indicators were selected.
3.Change sensitive. Except for the T-index components whose monitoring started in 2021 all other components go back in time at least 12 years and can be compared across years in the Trends menu on the Corruption Risk forecast page. No statistical process blurs the difference across years as with perception indicators. For long term trends, we flag what change is significant and what change is not. T-index components will also be comparable across the nest years to come. Furthermore, our indicators are selected to be actionable, so any significant policy intervention which has an impact is captured and reported when we renew the data.
4.Comparative. You can compare every country we cover with the rest of the world to see exactly where it stands, and against its peers from the region and the income group.
5.Transparent. Our T-index data allows you to review and contribute to our work. Use the feedback form on T-index page to send input, and after checking by our team we will upgrade the codes to include your contribution. Use the feedback form on Corruption Risk forecast page to contribute to the forecast.
Other evidences
Public procurement counts for 14% of the EU’s GDP. Businesses, especially SMEs,seek lower barriers to participati...
Learn moreOpenness in procurement can improve procurement in multiple ways, including more integrity, efficiency, level playi...
Learn moreAccording to recent estimates from the Open Contracting Partnership and Spend Network, governments globally spend U...
Learn more

